

A few months ago I shared a review of a 3D printer from the Wall Street Journal which incorporated a 3D data visualization. Here’s a look at someone making this more than just an oddity, but rather a serious attempt at improving visual communication of data visualizations. – Dean Meyers
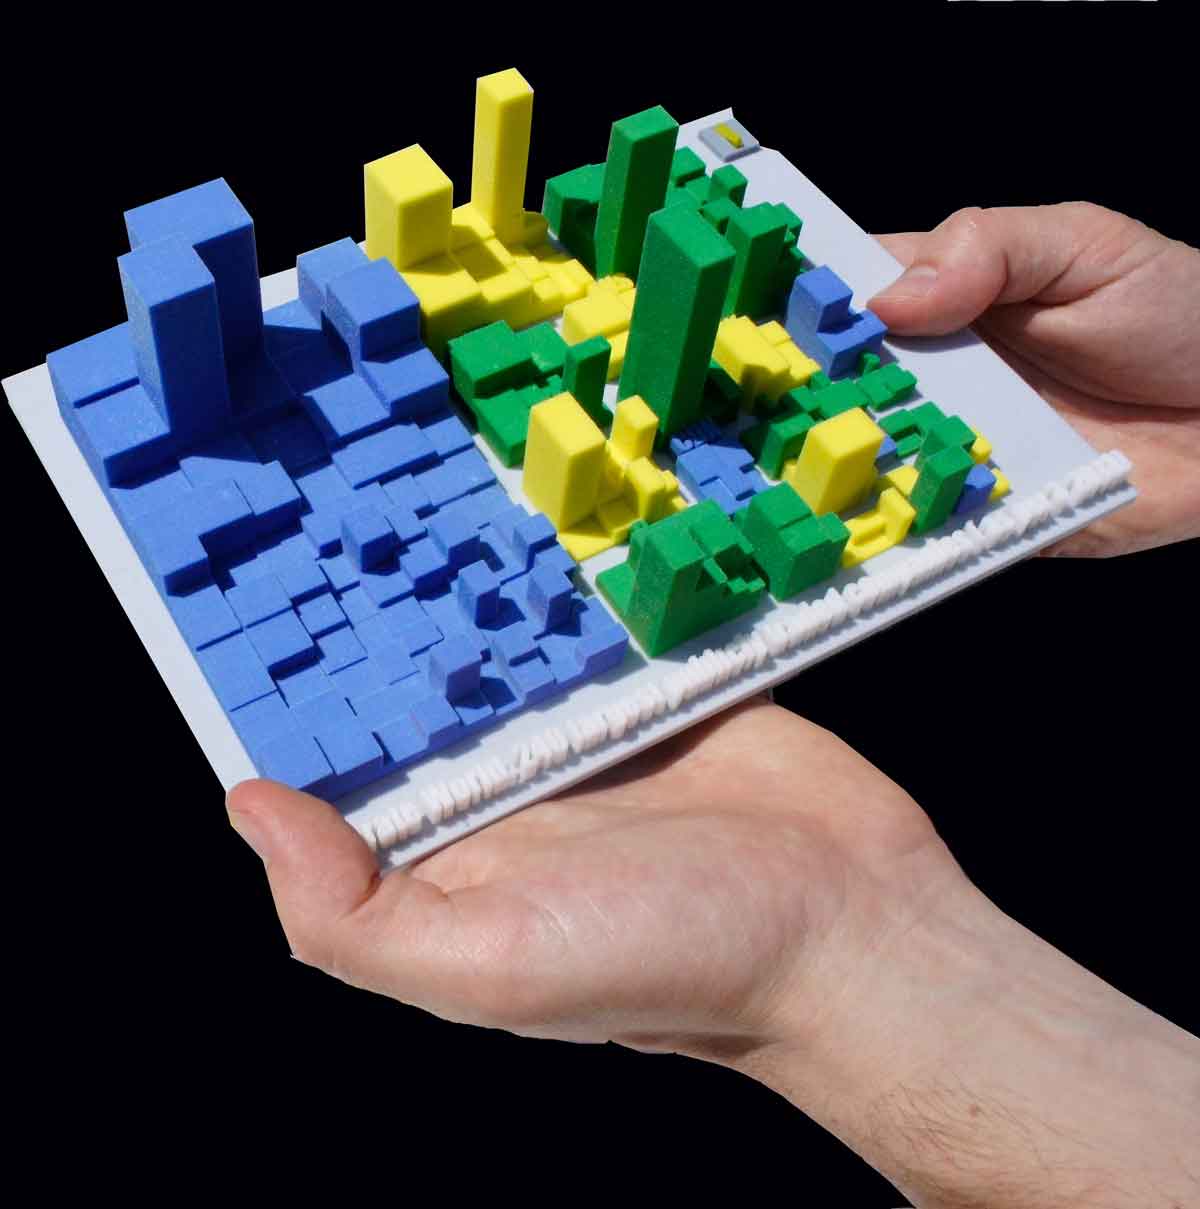
Until recently the 3D printing industry was focused primarily on bringing digital representations of products to life. Designers and mechanical engineers were using additive manufacturing technologies to simply turn their 3D models into real objects, which populate our daily life. Volker Schweisfurth of Germany decided to take the technology a step further as he uses 3D printing in a radically new way. He is among the first ones to imagine a way to visualize data with 3D printed sculptures. Instead of following the digital-to-reality path developed by 3D printers, he instead developed a way to give life to data through 3D printing.
Based in Germany, Schweisfurth has paved a new way for anyone willing to display data in creative way. He explains: “Until now, online services were focused primarily on creating objects for industries that are deeply rooted in everyday life-like miniatures, figurines, jewelry. But the meta-world of data was largely ignored.”
As he has observed, clients and coworkers interpret information in a multitude ways, and the key metrics of a spreadsheet during a presentation are not always perfectly relayed with a simple 2D graph. Having a physical object on the table allows the audience to hold and interpret the data in their own hands.
“Clear and concise data representation is important when it comes to all interpretation styles. A 3D representation offers the ability to really knock home a certain data set with everyone that will see it.”
This new way of representing data also allows people to see facts they might otherwise not realize at first glance.
“People probably will not go rummaging through the Internet looking to find a report from the World Bank about population estimations in 2050, and they may never realize that the population of China will be quickly passed by that of India.” The 3D printing offers a quick and inherently interesting way to understand information without other data convoluting the message.
Schweisfurth has been focused primarily on bringing demographic data to life using the 3D printing services of Sculpteo (www.sculpteo.com). Prints that, for example, could be displayed by national or international administrations to visually represent their data.
“This makes an easy way to compare the evolution of populations depending on the gender of individuals. This kind of data is easy to map in color on a 3D model and the precision of the print can display the differences between a man and women with an accuracy of 1-2mm between heights,” states Schweisfurth.
In the future, 3D printed data sculptures will probably populate board meetings, consultancy firms and redaction rooms. One of the main reasons for that is that big startups and big companies will soon start offering software to directly export data in a 3D model. This trend will be helped in its development by an accessible price for those 3D sculptures. To make those statistics real, Volker used Sculpteo’s multicolor material.
“When I started the project I had a rough idea of the cost of such a thing, but I didn’t expect it to be that affordable. Some of the infographics I turned into 3D didn’t cost more than 30 euros and it’s possible to make almost any statistic dramatically pop for fewer than 100 euros.”
Maybe it’s time to get data off the screen.


[…] A few months ago I shared a review of a 3D printer from the Wall Street Journal which incorporated a 3D data visualization. […]
[…] can use a 3D printer to create objects that embody data, i.e. “A New Way of Representing Data.” And with that, my mind was expanded: 3D printers can be a tool for scholarly communication, […]