

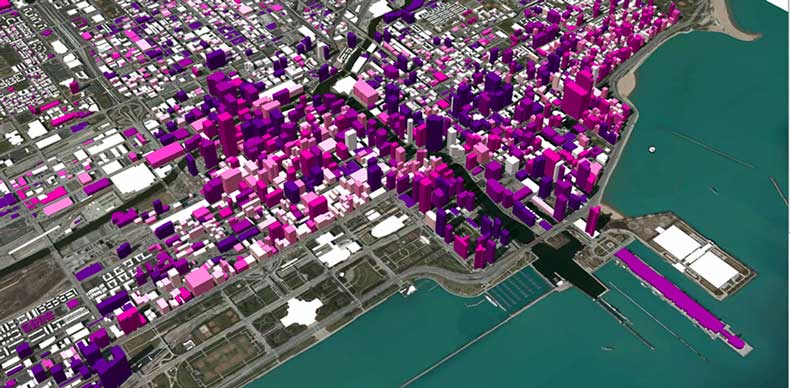
Synthicity has released a free public beta version of GeoCanvas, its 3D spatial data visualization tool. The software provides a streamlined toolset for exploring geographic data, lowering the barrier to learning and using geographic information systems.
[youtube url=”http://www.youtube.com/watch?v=XQNzo11ncSc” fs=”1″ hd=”1″ rel=”0″ showsearch=”0″]
“GeoCanvas combines ease of use with fast handling of large data sets, enabling both novices and experienced data scientists to create compelling 2D and 3D visualizations quickly.”
“Synthicity originally developed GeoCanvas as an in-house tool for use by its team of data scientists. Faced with the difficult problem of how to rapidly visualize large scale urban data sets, and discouraged with the performance of off the shelf GIS tools, the team designed GeoCanvas to address their needs efficiently,” says Paul Waddell, President and Founder of Synthicity, and Chair of City and Regional Planning at UC Berkeley.
Synthicity GeoCanvas
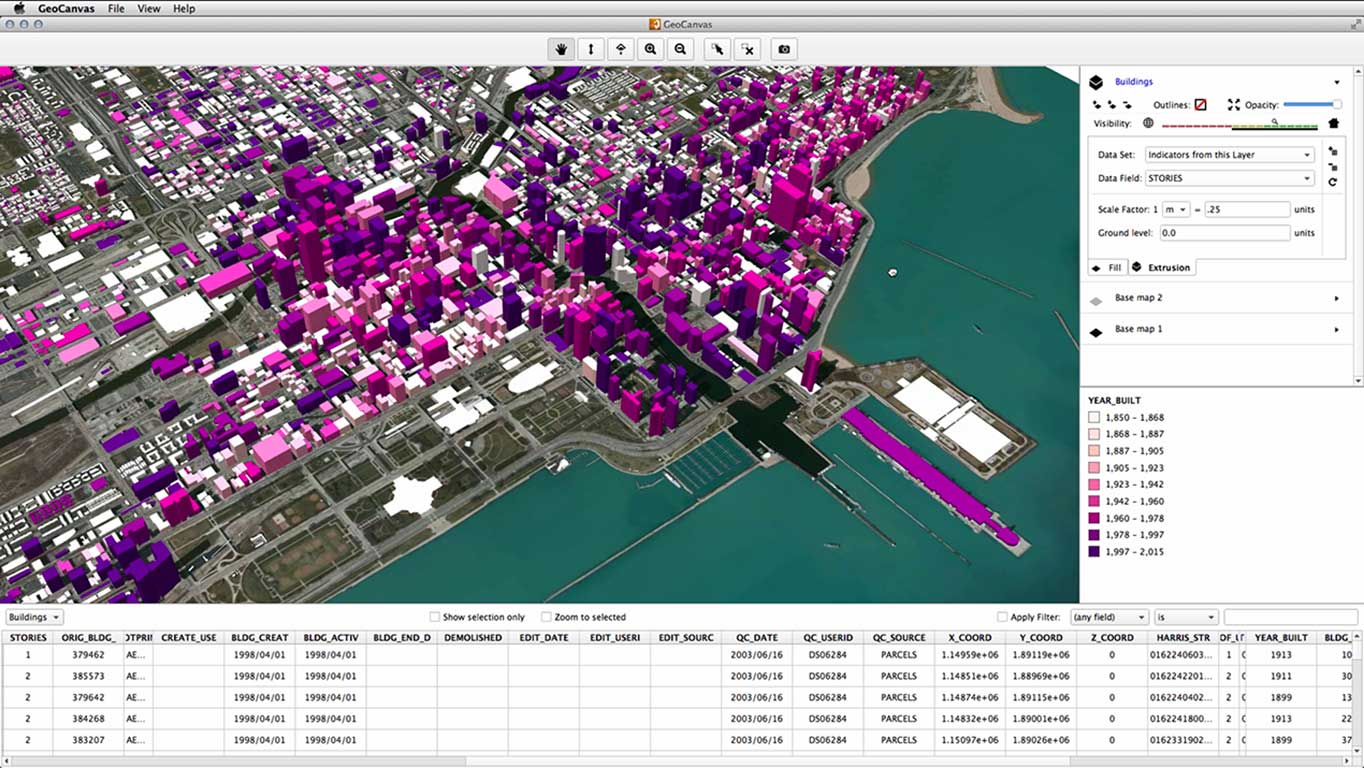
The in-house team depends on a suite of open-source software for data analysis, including PostGIS and Python with data science libraries. GeoCanvas was designed to interoperate closely with these tools to support an analytical workflow, and can connect directly to PostGIS databases, and import and join tabular data containing attributes for rapid data exploration.
GeoCanvas is not limited to visualizing parcels in cities. By supporting data formats such as the widely available shapefile for spatial geometry and text files for attribute data, it opens the possibility of rapid 3D spatial data visualization for a wide range of uses and users. The software is expected to be a great addition to the toolkits of students, researchers, and practitioners in fields as diverse as data science, geography, planning, real estate analysis, and market research. A set of video tutorials explaining the basic concepts and a range of examples have been made available to showcase the possibilities.
By providing a carefully curated set of tools, GeoCanvas eliminates a lot of the complexity inherent to traditional GIS systems, and presents a streamlined and intuitive user interface. This makes it easier to get up to speed quickly, and create great visualizations faster, for experts and beginners alike. For more advanced users that want to leverage the tools of scientific Python, GeoCanvas transforms their workflow into a visual data science laboratory.
The public beta version of GeoCanvas is available as a free download from www.synthicity.com.


[…] Synthicity Releases 3D Spatial Data Visualization Tool, GeoCanvas by Dean Meyers. […]
[…] See on vizworld.com […]
[…] Synthicity Releases 3D Spatial Data Visualization Tool, GeoCanvas VizWorld.com Synthicity has released a free public beta version of GeoCanvas, its 3D spatial data visualization tool. […]