

 IBM has created this straight-forward infographic to help retailers, by looking at the last holiday season and giving a visual narrative of the change in retail shopping habits by consumers.
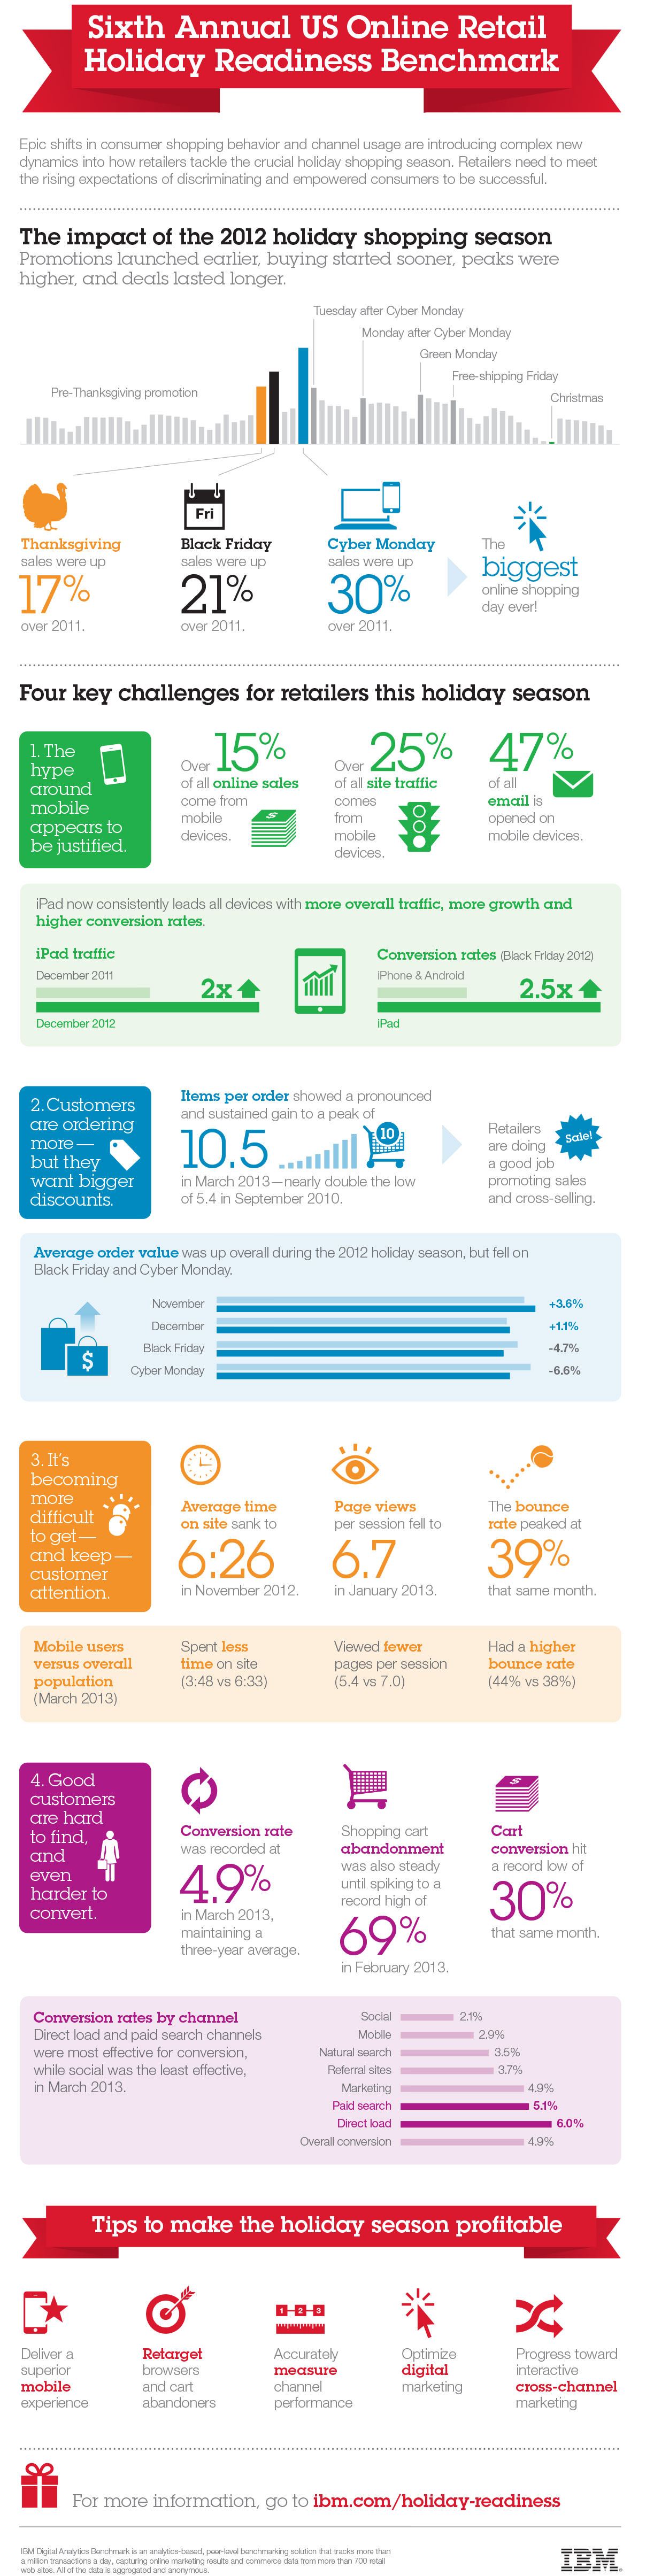
Viewing data related to both advertising and to the types of devices used to consume information, this infographic is completely grounded in the idea of customer focus online, conversion, page views and bounce rates… all part and parcel of the language of Google analytics.
The graphics are simple and straightforward; flat iconography, white background, and the common vertical format drives you to look at the 5 tips at the end.
IBM states their source as their very own IBM Digital Analytics Benchmark, capturing online marketing results and commerce data from more than 700 retail web sites. All of the data is aggregated and anonymous.
For a deeper look (and a landing page that offers an on-demand webinar as well as additional reports), you can find the original infographic as a PDF at http://ibm.com/holiday-readiness


