
 Infothestics points us to a new tool from the folks at visual.ly called “Start Up Universe“. It’s an interactive visualization of the large Crunchbase database, showing the various connections between startups, founders, and venture capital companies that fund them.
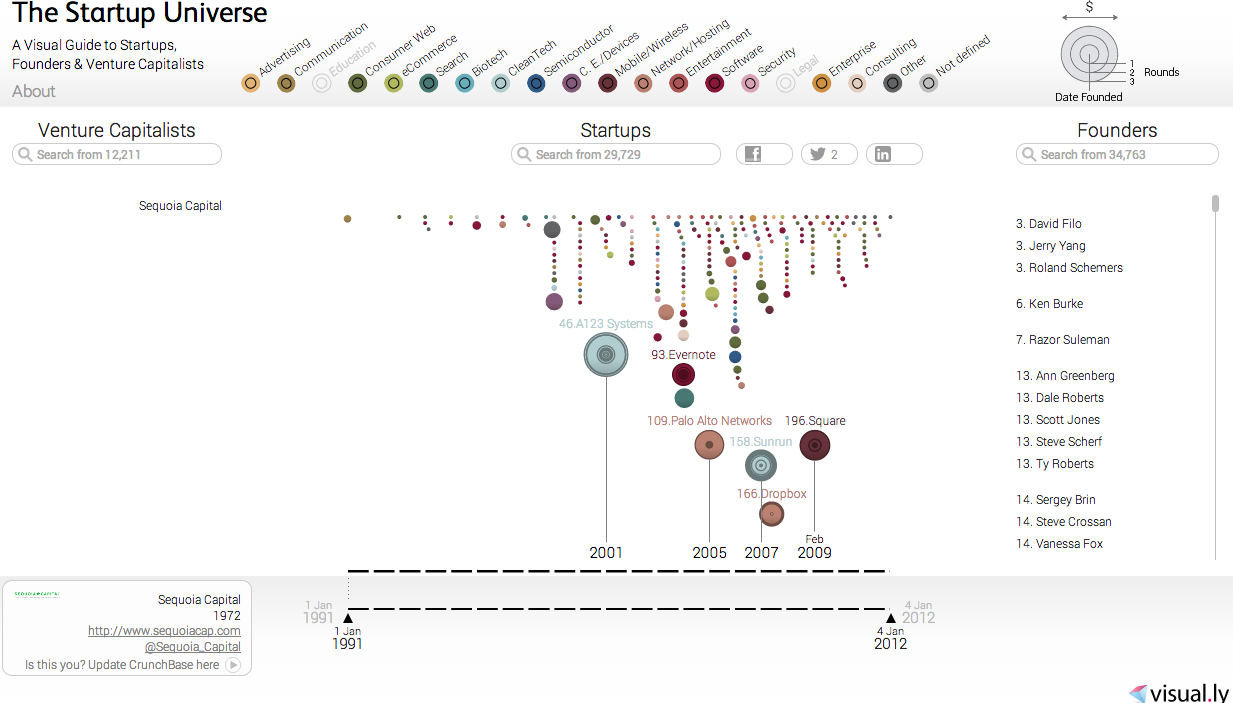
All startups are represented as circles that are colored according to one of the 19 categories (conveying the service or industry of the startup) and scaled according to the amount of financing they have raised. In particular views, the circles are positioned on a horizontal timeline, which can be filtered according to particular periods of interest.
At first I played with the Startups entry, and frankly wasn’t impressed. Many of the companies I tried weren’t in the database. However, playing with the VC or Founders side is fascinating, showing the multitude of companies along with categories, amounts, and timeframes of each. You can create some interesting trend visuals, such as the investment history of Sequoia Capital shown above, and very quickly see the few “big wins” (Evernote, Dropbox, Square) amongst the multitude of smaller investments.
via Startup Universe: Connecting Startup Companies, Founders and Investors – information aesthetics.


