
Tableau has an interesting visualization of the many natural disasters in the last 2 decades and lets you look at death tools, financial damage, and other figures across the US.
I used the visualization and zoomed in to see what’s been happening since 2004. The cost of Hurricane Katrina was $145 billion and caused 1,833 deaths. As you’ll notice in the image above, Katrina is the dot way up at the top along 2005. By comparison, Irene cost $7 billion and caused 21 deaths.
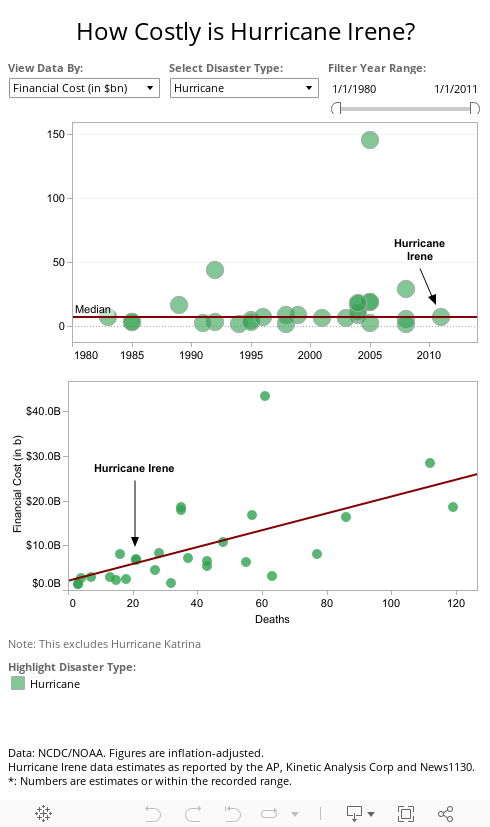
via Visualization: How does Hurricane Irene compare to other hurricanes? | SmartPlanet.


