A few weeks ago we brought you the news of Piero Zagami’s UN Security Council Resolutions (UNSC/R) Visualizations Report , a fantastic collection of visualizations and data regarding resolutions from the UN Security Council. It took a while, but he took some time to sit down and give us some details on the project and some fantastic higher-resolution images from the report.
Read his information after the break.
BACKGROUND
Information design always intrigued me because the designer, by visualizing information, can act as a scientist. During my studies in politics I remember how teachers wanted us to think as social scientists in political matters and try to be neutral and objective in our studies and analysis. When I approached information design for the first time I noticed that maybe graphic design and social sciences (such as politics) can have many things in common with a scientific methodology. The UNSC/R project looks at politics in its aspects connected to education. The subject area of the United Nations is analyzed in disciplines such as international politics. As a former student of this field of study, my aim as a graphic designer was to explore information design strategies, and apply them to help students in politics, by creating tools that can improve their learning process.
DATA
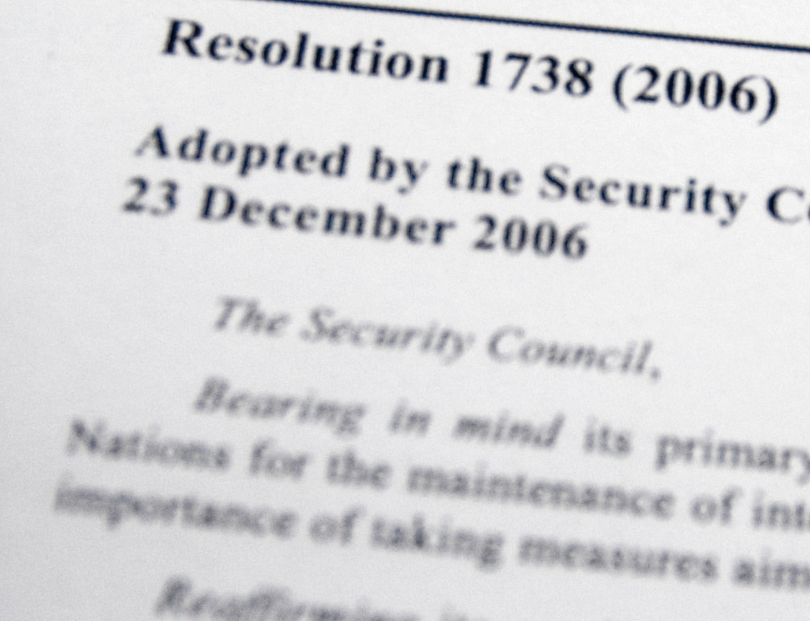
 The UN Resolutions issued by the Security Council are more than 1700; this massive amount of data doesn’t’ come in an organized form because those documents constitute the decisions of the UN executive body (the Security Council), therefore the only parameter of classification is the numerical order and the date displayed on the document. A map that displays UN Resolutions is an idea based on the belief that such a tool will allow users to have a visual representation of this multitude of data, and it will help students, professors and experts that work in the United Nations, to improve their work. The first step of my project development was to collect the data, followed by their analysis and classification. By focusing my mapping strategies on the organization of the body of documents issued by the Security Council, my first task was to get a hold on the amount of documents (Resolutions) produced. The UNSC Resolutions are files (each one between one and twenty pages ca.) that summarize the most important decisions taken by the members of the Security Council in regard to situations that can be athreat to the international security and peace, admission of new members, or it can issue topics related to the Organization itself.
DEVELOPMENT
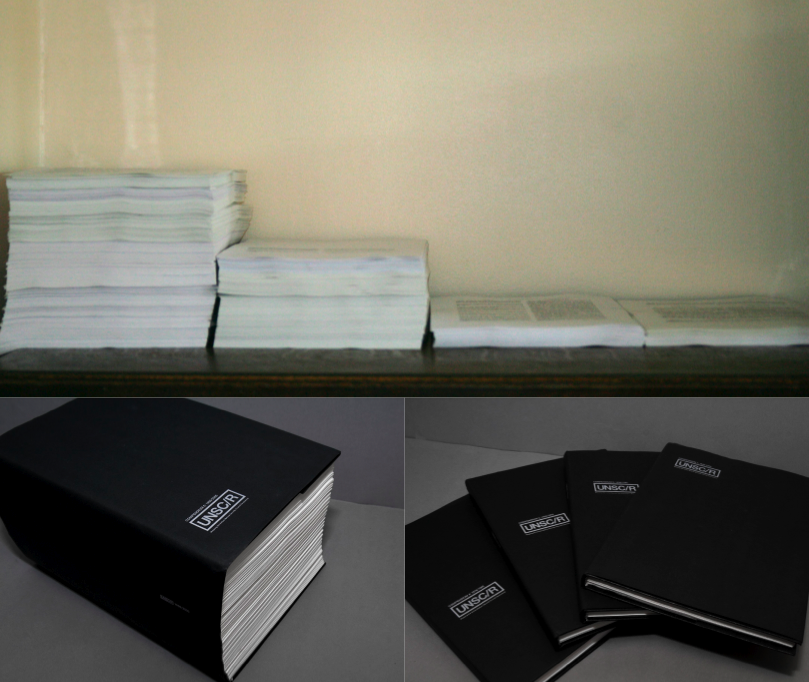
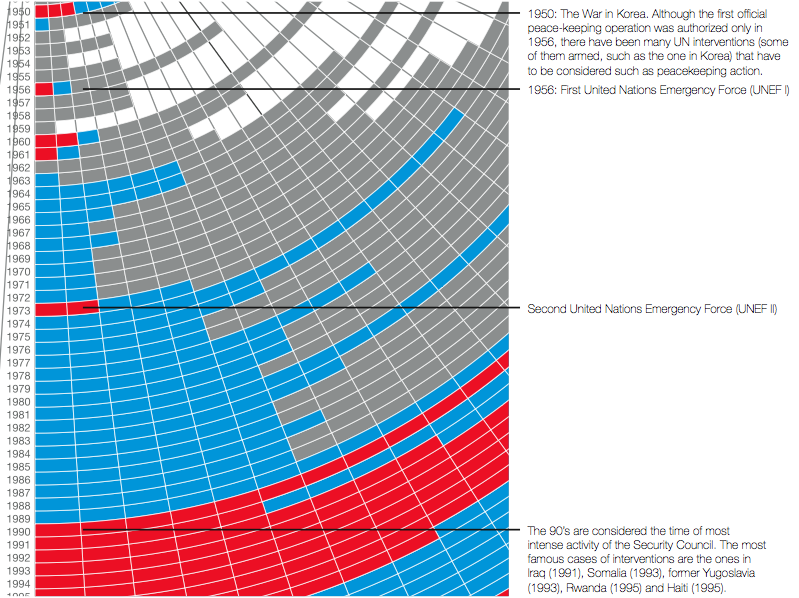
 Throughout the documents analysis I noticed that more than 70% of them were referring to the Resolutions produced after 1990 (more than 50% of the whole body of Resolutions). That is because right after the fall of communism and the end of the cold war, the UN activity increased a lot, especially in matters related to international security. I decided to display this increment of activity of the UN by classifying the collected documents in several books divided by periods of time. I produced six of them, each one containing 10 years of Resolutions. The books are very different in volume between each other and that is the because of the different intensity of the UN activity in the decades considered. This experiment (based on classifying and binding the documents together) helped me to test an unusual mapping exercise, a map based on books and on the visual impact of those books.
VISUALIZATIONS
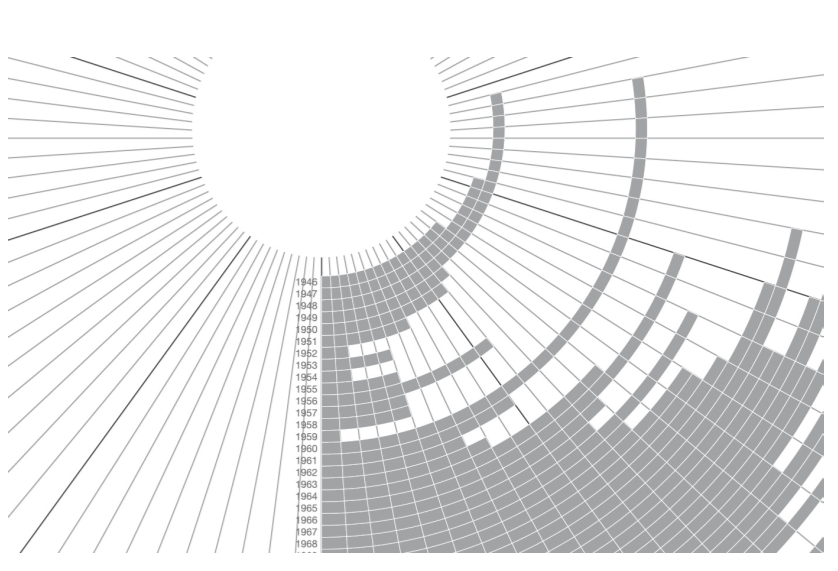
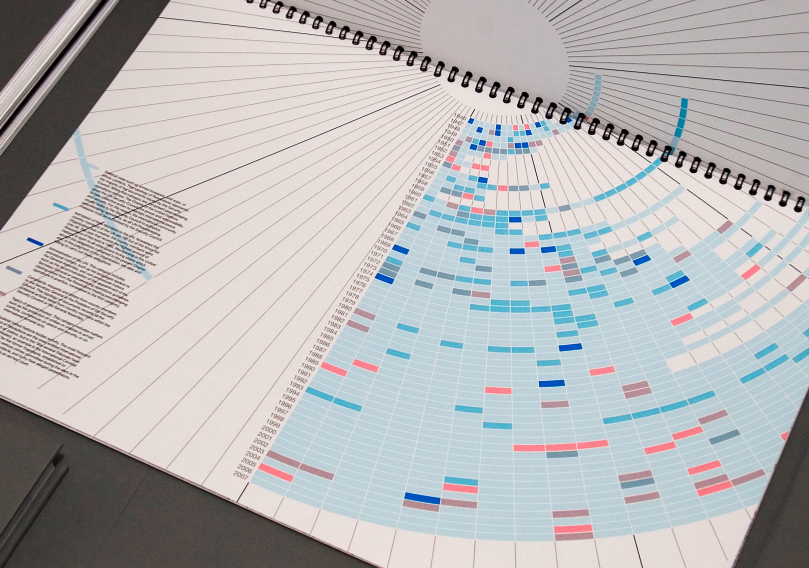
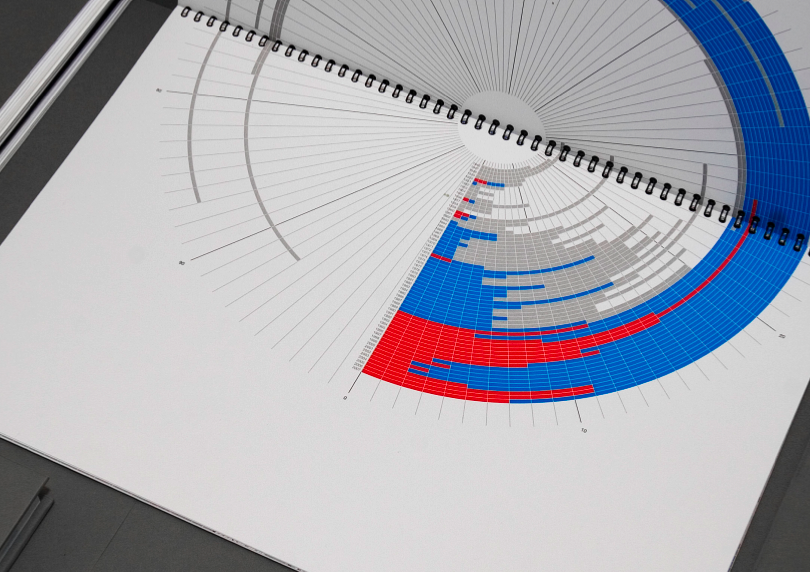
 The series of visualizations that corresponds to the final graphic development of the project are different expressions of a system meant to contain and display the Resolutions as graphic objects on a grid. The main paramater is the timeline that goes from the center (previous years, starting from 1946, the year zero of the UN) to the external rings. The system works as a data container, and information can be displayed in different ways, depending on what aspects of the Resolutions are more relevant to the user. In my series I visualized the Resolutions highlighting each time something different as the peacekeeping Resolutions, the increment of activity of the Security Council in the ‘90s or a cluster-based classification based on political parameters.
RESULTS
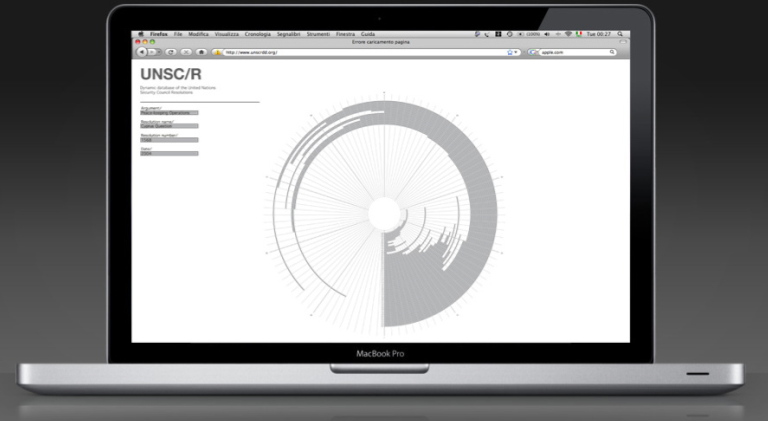
The series of experiments I produced during the project was aimed to find the best form of data visualization of this system. The production of a series of printed out- comes was finalized to promote the project to various categories of subjects within the selected target audience (students, universities, organizations related to the UN, information and mapping design networks and communities). But the UNSC/R project is yet to be concluded. The next phase of the project will be focused on the development of an interactive platform that will turn the mapping design into a dynamic outcome, allowing users to research information about Resolutions, by selecting, classifying, comparing and isolating any of them. The website’s main characteristic will be: usability, precision, simple design, interactivity and dynamism. Therefore the website key aspects to be developed are: a user-friendly interface and a clear layout where users can easily learn the navigation routes and use the system as a compass to find information about the Resolutions, and other relevant cross-connections with similar documents.